
Help
My songs TutorialPurpose of this study
Our research group is working on algorithms for Music Emotion Variation Detection (MEVD), i.e., algorithms capable of automatically detecting emotion variations in songs over time. This is a relevant problem in Music Emotion Recognition (MER).
In order to validate those algorithms, we need to collect ground truth data, which will serve as reference to assess their quality. This is why we need your collaboration to perform a few manual annotations.
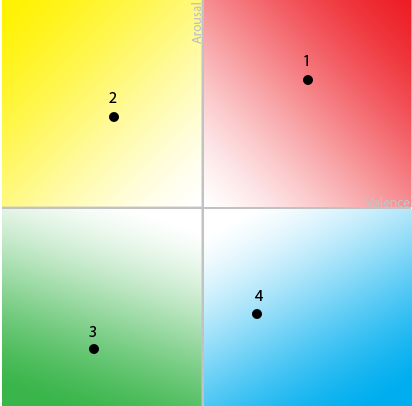
To this end, we need you to hear a number of songs and detect and annotate uniform segments, i.e., segments for which you think the perceived emotion is uniform. For each segment, you should assign a valence value and an arousal value (both between -1 and 1 in the Thayer emotion plane – see figure below). In other words, you define the emotion perceived in each segment as a point in the Thayer plane.
The figure below represents the Thayer plane. The 4 dots represent 4 example songs, located in the Thayer plane according to a previous annotation study (Yang, 2008). Click the dots to listen to the respective audio samples (courtesy of Yi-Hsuan Yang).
Important remarks
- Try to be objective regarding the emotions you believe a segment in a song expresses. Focus on the emotions you perceive in the song and not on the emotions you feel.
- Don't let your mood, memories or experiences influence the emotion you perceive in the song. Again, please try to be objective and focus on the emotions you believe the song expresses.
- Don't get tired while performing your annotations, as tiredness or boredom makes your annotations less accurate. If you feel tired or bored please stop for a while and come back later.
Presently, digital music repositories need more advanced, flexible and user-friendly search mechanisms, adapted to the requirements of individual users. In fact, "music's preeminent functions are social and psychological", and so "the most useful retrieval indexes are those that facilitate searching in conformity with such social and psychological functions. Typically, such indexes will focus on stylistic, mood, and similarity information." (Huron, 2000). This is supported by studies on music information behavior that have identified music mood/emotion as an important criterion for music retrieval and organization. As a result, Music Emotion Recognition (MER) has evolved as an important research topic on Music Information Retrieval (MIR).
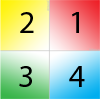
Continuous emotion plane, with two axes: valence (horizontal) and arousal (vertical). Those two axes divide the emotion plane into 4 quadrants, with emotions associated to each of them: 1) exuberance (energetic and happy music); 2) anxiety (energetic and frantic music); 3) depression (calm and anxious music); 4) contentment (calm and happy music). Each point in the plane denotes a different emotional state and songs are mapped to different points in the plane.
Associated to the type of emotion: positive or negative. For example, happy music has positive valence; sad music has negative valence. Very positive emotions (e.g., very happy music) would lead to valence values close to 1; very negative emotions (e.g., very sad or aggressive music) would lead to valence values close to -1. Use the [-1, 1] scale according to how positive or negative valence you perceive in the segment you are annotating.
Associated to the energy or stimulation level. For example, fast, loud music has positive arousal; slow, quiet music has negative arousal. Very strong arousal (e.g., very energic music) would lead to values close to 1; very low arousal (e.g., very quiet music) would leave to values close to -1. Use the [-1, 1] scale according to how strong or low arousal you perceive in the segment you are annotating.
Expressed emotion: refers to the emotion the performer tries to communicate to the listeners.
Perceived emotion: regards to the emotion you perceive as being expressed in a song (which may be different than the emotion the performer tries to communicate).
Felt emotion: occurs when you actually feel an emotion in response to a song.
In this study, we would like you to annotate the emotions you perceive as present in different segments of the songs you annotate.
Quick tutorial
The annotation tool intends to be clear and simple to use. In case you have any difficulties, please consult this brief tutorial with an example of how to define and annotate segments in a song.
Start annotating: go to my songs My songs
